Research
High-precision observational astrophysics: solar and stellar spectroscopy, stellar surface structure, radial velocities and wavelength shifts, methods in searches for exoplanets, intensity interferometry, quantum optics, and other.
Highest-precision stellar spectroscopy
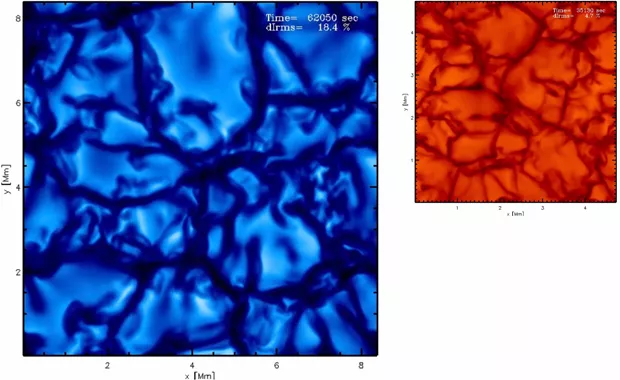
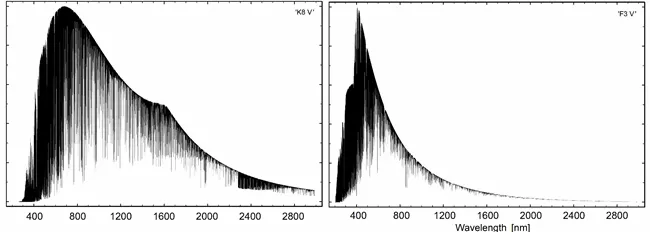
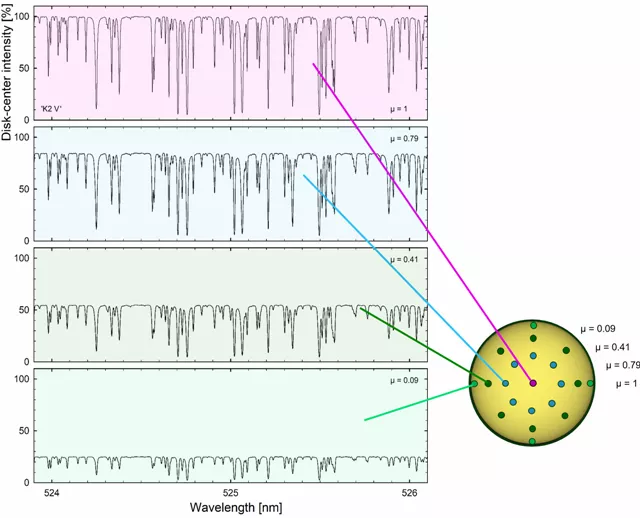
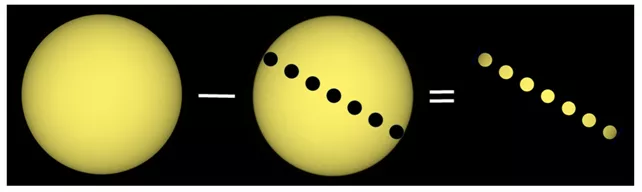
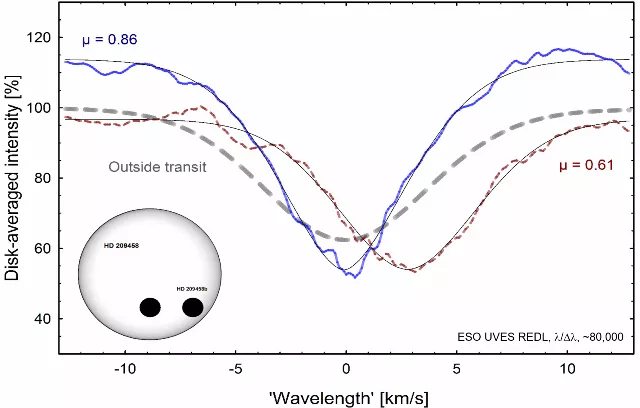
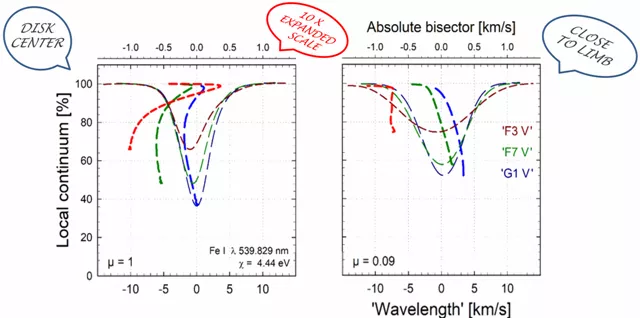
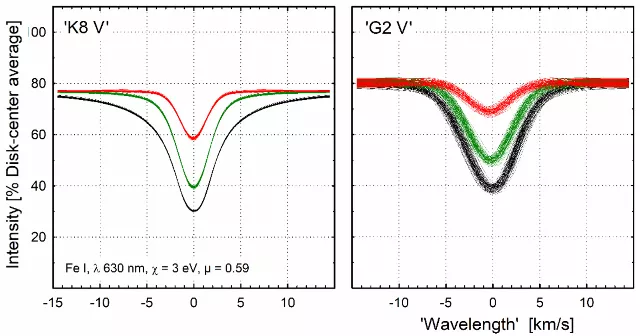
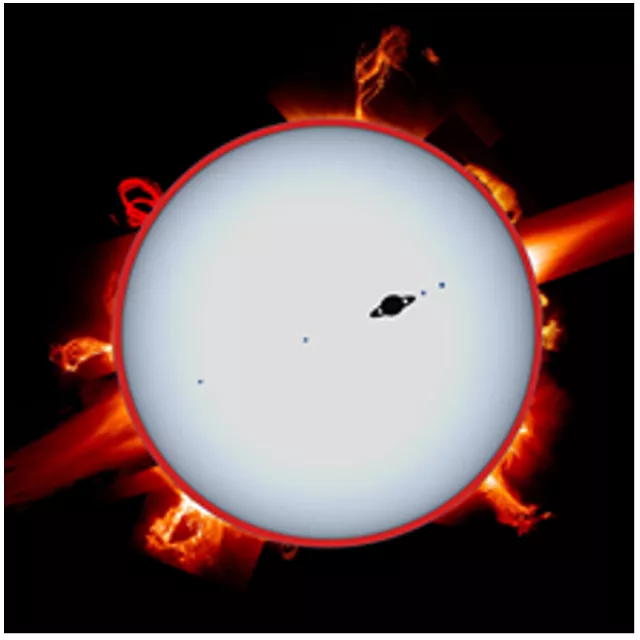
Spectroscopy reveals the structure of stellar surfaces and enables to determine their physical properties. ‘Ab-initio’ hydrodynamic simulations provide realistic descriptions for the convective photospheres of various stars. Such simulations enable synthetic spectra to be computed for various positions across stellar disks. These are confronted with observations across stellar surfaces, where the spatial resolution is enabled by transiting exoplanets.
Spectral microvariability and low-mass exoplanets
Finding small exoplanets comparable to the Earth in orbit around the Sun remains an outstanding challenge. Plausible detections might be through the radial-velocity wobble induced by the planet onto the star. Instrumental performances are about to be met but a limitation is set by stellar variability which overwhelms the tiny signal induced by a small planet. To understand how to segregate wavelength shifts caused by a planet from those caused by atmospheric motions, microvariability is studied in numerical time-dependent hydrodynamic simulations and in time series of the observed spectrum of the Sun seen-as-a-star.
Radial velocities without spectroscopy
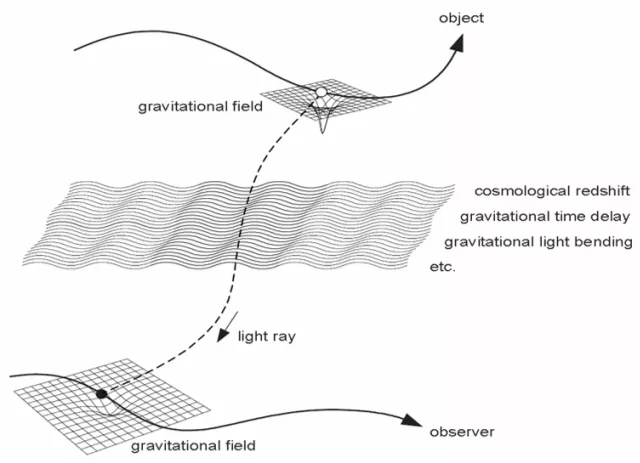
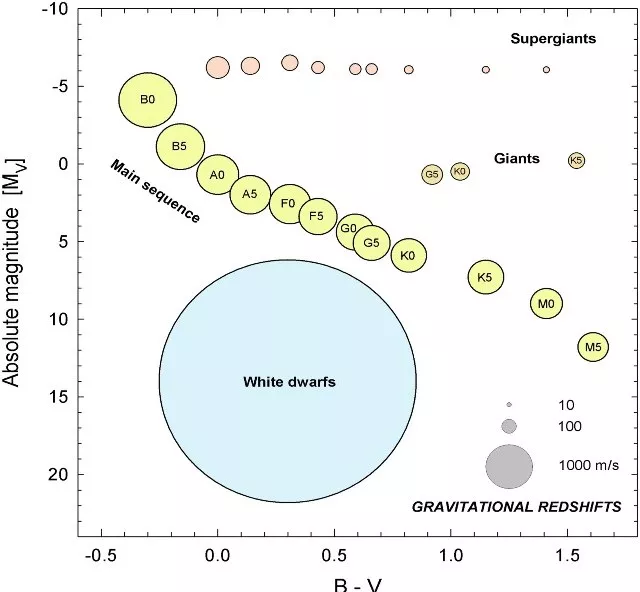
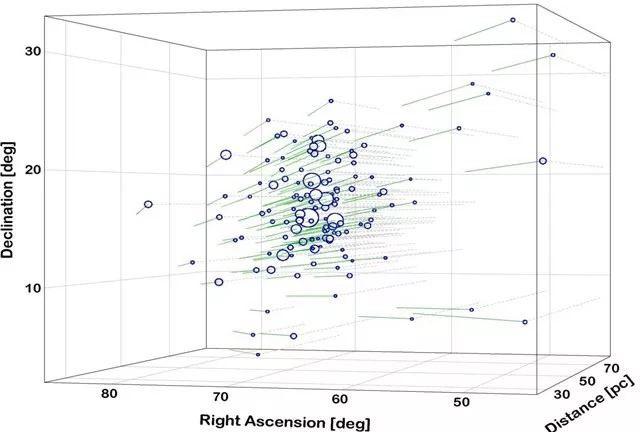
Wavelength shifts are commonly interpreted as caused through the Doppler effect by motion in the radial direction. However, they involve also effects such as convective-, gravitational-, or pressure-shifts. For nearby stars, their radial motion can also be determined through astrometry, without any spectroscopic measurements. The required accuracy is now available from the astrometric space missions of Hipparcos and Gaia.
A popular overview of the method is in an article by Ken Croswell:
Intensity interferometry
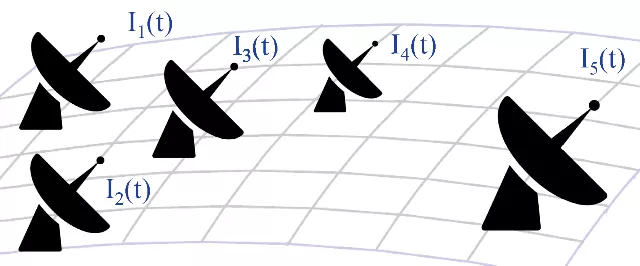
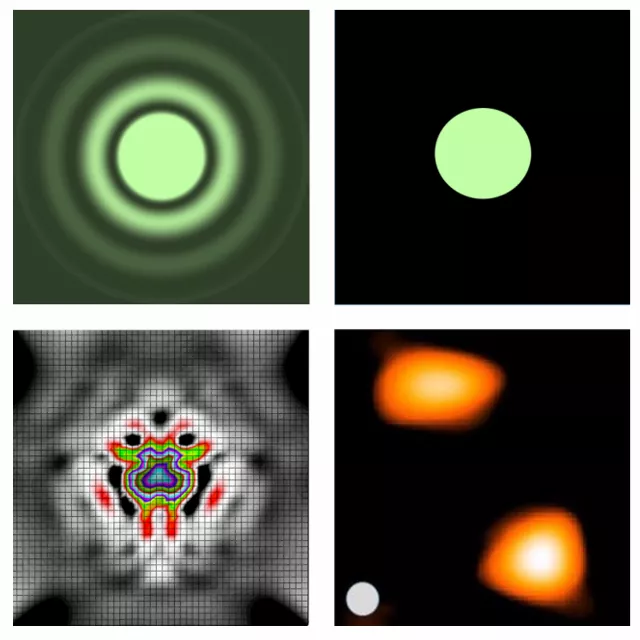
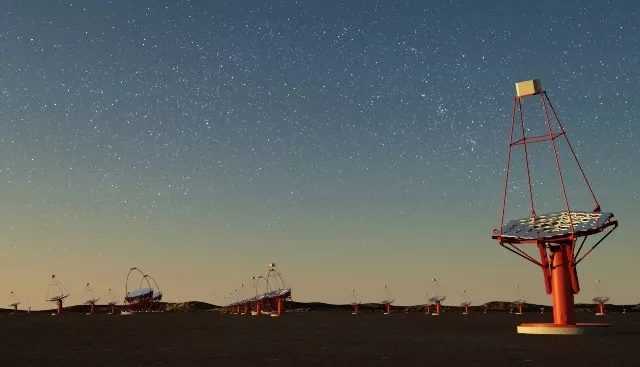
Direct imaging of stellar surfaces needs angular resolution in the tens of microarcseconds. The required kilometer-sized optical interferometers are becoming feasible by intensity interferometry, a quantum-optical method that is immune to both atmospheric turbulence and telescopic imperfections. This exploits the way instantaneous intensity fluctuations correlate between light measured in separate telescopes. Telescopes monitor the intensity of starlight with a very high time resolution and the noise budget relates to electronic timescales of nanoseconds and corresponding light-travel distances of many centimeters (speed of light =30 cm/ns) rather than fractions of an optical wavelength. The method can be used on air Cherenkov telescopes erected to study gamma-ray sources from optical flashes in the atmosphere. In particular, CTA - the Cherenkov Telescope Array, with its numerous telescopes planned across its southern site in Chile, will be particularly suitable for stellar surface imaging.
Other astronomical quantum optics
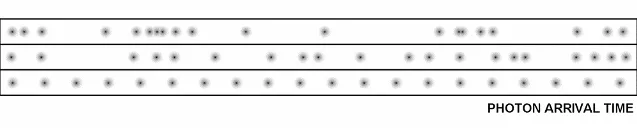
Intensity interferometry has, so far, been the only astronomical application of quantum optics. However, in principle, a stream of photons carries much additional information besides its classical properties of intensity, spectrum, and polarization. Extremely large telescopes will provide particularly large photon fluxes and may permit the study of also quantities such as the statistics of photon arrival times.
REFERENCES
Highest-precision stellar spectroscopy
D.Dravins, H.-G.Ludwig, B.Freytag: Spatially resolved spectroscopy across stellar surfaces. V. Observational prospects: Toward Earth-like exoplanet detection, Astron.Astrophys. 649, A17 (2021), https://ui.adsabs.harvard.edu/abs/2021A%26A...649A..17D/abstract
D.Dravins, H.-G.Ludwig, B.Freytag: Spatially resolved spectroscopy across stellar surfaces. IV. F, G, & K-stars: Synthetic 3D spectra at hyper-high resolution, Astron.Astrophys. 649, A16 (2021), https://ui.adsabs.harvard.edu/abs/2021A%26A...649A..16D/abstract
D.Dravins, M.Gustavsson, H.-G.Ludwig: Spatially Resolved Spectroscopy across Stellar Surfaces. III. Photospheric Fe I Lines across HD189733A (K1 V), Astron.Astrophys. 616, A144 (2018), https://ui.adsabs.harvard.edu/abs/2018A%26A...616A.144D/abstract
D.Dravins, H.-G.Ludwig, E.Dahlén, H.Pazira: Spatially resolved spectroscopy across stellar surfaces. II. High-resolution spectra across HD209458 (G0 V), Astron.Astrophys. 605, A91 (2017), https://ui.adsabs.harvard.edu/abs/2017A%26A...605A..91D/abstract
D.Dravins, H.-G.Ludwig, E.Dahlén, H.Pazira: Spatially resolved spectroscopy across stellar surfaces. I. Using exoplanet transits to analyze 3-D stellar atmospheres, Astron.Astrophys. 605, A90 (2017), https://ui.adsabs.harvard.edu/abs/2017A%26A...605A..90D/abstract
D.Dravins: High-fidelity spectroscopy at the highest resolutions, Astron.Nachr. 331, 535 (2010), https://ui.adsabs.harvard.edu/abs/2010AN....331..535D/abstract
D.Dravins: 'Ultimate' Information Content in Solar and Stellar Spectra: Photospheric line asymmetries and wavelength shifts, Astron.Astrophys. 492, 199 (2008),https://ui.adsabs.harvard.edu/abs/2008A%26A...492..199D/abstract
Radial velocities without spectroscopy
L.Lindegren, D.Dravins: Astrometric radial velocities for nearby stars, Astron.Astrophys. 652, A45 (2021), https://ui.adsabs.harvard.edu/abs/2021A%26A...652A..45L/abstract
L.Lindegren, D.Dravins: The fundamental definition of ‘radial velocity’, Astron.Astrophys. 401, 1185 (2003), https://ui.adsabs.harvard.edu/abs/2003A%26A...401.1185L/abstract
S.Madsen, D.Dravins, L.Lindegren: Astrometric Radial Velocities III. Hipparcos measurements of nearby star clusters and associations, Astron.Astrophys. 381, 446 (2002), https://ui.adsabs.harvard.edu/abs/2002A%26A...381..446M/abstract
L.Lindegren, S.Madsen, D.Dravins: Astrometric Radial Velocities II. Maximum-likelihood estimation of radial velocities in moving clusters, Astron.Astrophys. 356, 1119 (2000), https://ui.adsabs.harvard.edu/abs/2000A%26A...356.1119L/abstract
D.Dravins, L.Lindegren, S.Madsen: Astrometric Radial Velocities I. Non-spectroscopic methods for measuring stellar radial velocity, Astron.Astrophys. 348, 1040 (1999), https://ui.adsabs.harvard.edu/abs/1999A%26A...348.1040D/abstract
Intensity interferometry and quantum optics
D.Dravins: Intensity interferometry, chapter in: The WSPC Handbook of Astronomical Instrumentation, vol.3, Part 2, pp.31-43 (2021), https://ui.adsabs.harvard.edu/abs/2021hai3.book.....M/abstract
D.Dravins: Intensity interferometry: Optical imaging with kilometer baselines, Proc. SPIE 9907, 99070M (2016), https://ui.adsabs.harvard.edu/abs/2016SPIE.9907E..0MD/abstract
D.Dravins, T.Lagadec, P.D.Nuñez: Long-baseline optical intensity interferometry – Laboratory demonstration of diffraction-limited imaging, Astron.Astrophys, 580, A99 (2015), https://ui.adsabs.harvard.edu/abs/2015A%26A...580A..99D/abstract
D.Dravins, T.Lagadec, P.D.Nuñez: Optical aperture synthesis with electronically connected telescopes, Nature Communications, 6, 6852 (2015), https://ui.adsabs.harvard.edu/abs/2015NatCo...6.6852D/
D.Dravins, S.LeBohec, H.Jensen, P.D.Nuñez, for the CTA Consortium: Optical Intensity Interferometry with the Cherenkov Telescope Array, Astroparticle Physics 43, 331 (2013), https://ui.adsabs.harvard.edu/abs/2013APh....43..331D/abstract
D.Dravins, S.LeBohec, H.Jensen, P.D.Nuñez: Stellar Intensity Interferometry: Prospects for sub-milliarcsecond optical imaging, New Astronomy Reviews 56, 143 (2012), https://ui.adsabs.harvard.edu/abs/2012NewAR..56..143D
D.Dravins: Photonic Astronomy and Quantum Optics, In D.Phelan, O.Ryan & A.Shearer, eds.: High Time Resolution Astrophysics, Astrophysics and Space Science Library vol. 351, 95, Springer (2008), https://ui.adsabs.harvard.edu/abs/2008ASSL..351...95D/abstract
D.Dravins, C.Barbieri, V.Da Deppo, D.Faria, S.Fornasier, R.A.E.Fosbury, L.Lindegren, G.Naletto, R.Nilsson, T.Occhipinti, F.Tamburini, H.Uthas, L.Zampieri: QuantEYE: Quantum Optics Instrumentation for Astronomy (Designing a quantum-optical instrument for extremely large telescopes), ESO ELT Instrument Concept Study; 280 pp. (2005), https://www.eso.org/sci/facilities/eelt/owl/Files/publications/OWL-CSR-…
================================================================================
Additional material is on the Research Pages at the previous website:
http://staff.astro.lu.se/~dainis/dainis_dravins_lund_observatory_4.htm&…;
================================================================================
text and pictures
Pictures and text